Microsoft Excel - Sparklines

Learn about sparklines
What are sparklines?
Unlike charts on an Excel worksheet, sparklines are not objects; a sparkline is actually a tiny chart in the background of a cell.
The following picture shows a column sparkline in cell F2 and a line sparkline in F3. Both of these sparklines get their data from cells A2 through E2 and display a chart inside a cell that shows the performance of a stock. The charts show the values by quarter, highlight the high value (3/31/08) and the low value (12/31/08), show all the data points, and show the downward trend for the year.
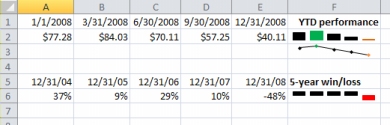
A sparkline in cell F6 shows the 5-year performance for the same stock, but displays a Win/Loss bar chart that shows only whether the year had a gain (as in the years 2004 through 2007) or a loss (2008). This sparkline uses values from cells A6 through E6.
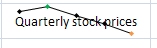
Because a sparkline is a tiny chart embedded in a cell, you can enter text in a cell and use a sparkline as its background, as shown in the following picture.
In this sparkline, the high value marker is green, and the low value marker is orange. All other markers are shown in black.
You can apply a color scheme to your sparklines by choosing a built-in format from the Style gallery (Design tab, which becomes available when you select a cell that contains a sparkline). You can use the Sparkline Color or Marker Color commands to choose a color for the high, low, first, and last values (such as green for high, and orange for low).
Why use sparklines?
Data presented in a row or column is useful, but patterns can be hard to spot at a glance. The context for these numbers can be provided by inserting sparklines next to the data. Taking up a small amount of room, a sparkline can display a trend based on adjacent data in a clear and compact graphical representation. Although it's not mandatory for a sparkline cell to be directly next to its underlying data, it is a good practice.
You can quickly see the relationship between a sparkline and its underlying data, and when your data changes you can see the change in the sparkline immediately. In addition to creating a single sparkline for a row or column of data, you can create several sparklines at the same time by selecting multiple cells that correspond to underlying data, as shown in the following picture.
You can also create sparklines for rows of data that you add later by using the fill handle on an adjacent cell that contains a sparkline.
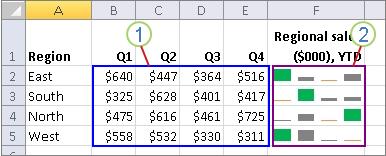
- The range of data used by a group of sparklines
- A group of sparklines
One advantage of using sparklines is that, unlike charts, sparklines are printed when you print a worksheet that contains them.
Create a sparkline
Click to download the
![]() example file.
example file.
- Select an empty cell or group of empty cells in which you want to insert one or more sparklines.
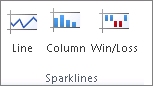
- On the Insert tab, in the Sparklines group, click the type of sparkline that you want to create: Line, Column, or Win/Loss.
- In the Data Range box, type the range of the cells that contain the data on which you want to base the sparklines.
Note: You can click  to temporarily collapse the dialog box, select the range of cells that you want on the worksheet, and then click
  to restore the dialog box to its normal size.
When one or more sparklines are selected on the worksheet, the Sparkline Tools appear, displaying the Design tab.
On the Design tab, you can choose one or more of several commands from among the following groups: Sparkline, Type, Show, Style, and Group.
Use these commands to create a new sparkline, change its type, format it, show or hide data points on a line sparkline, or format the vertical axis in a sparkline group. These options are described in detail in the following section.